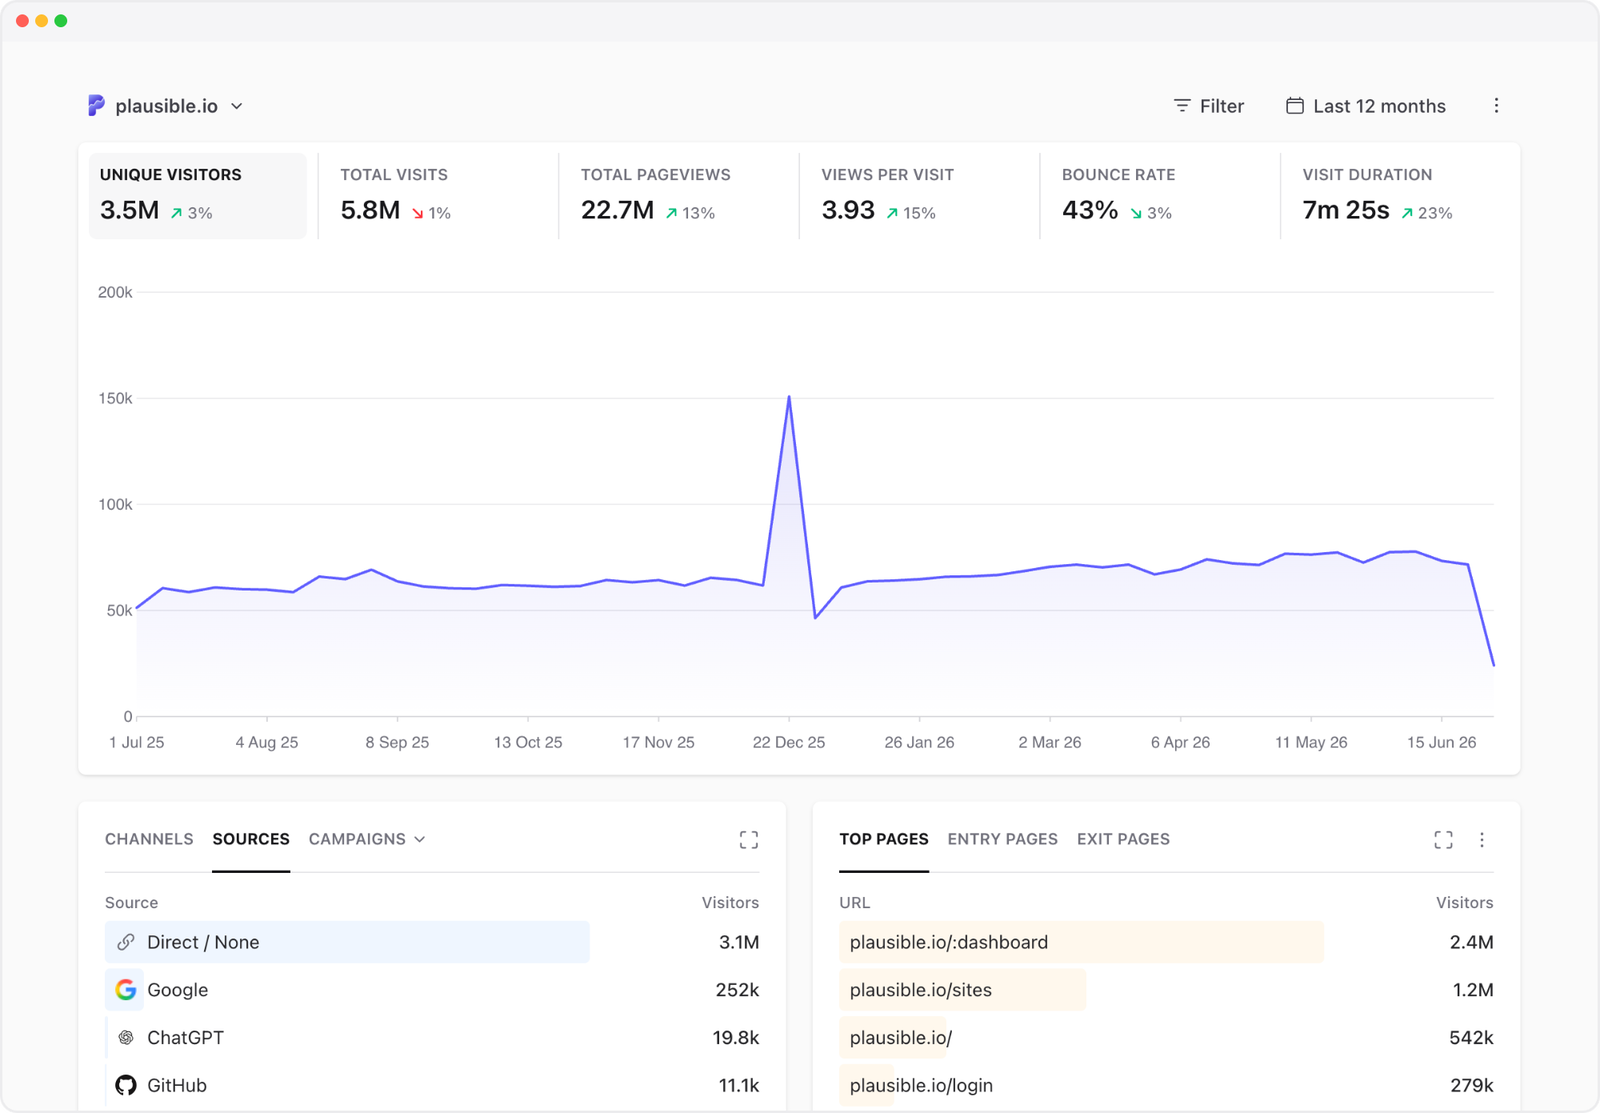
Web analytics helps you understand how people find and use your website. How many people visit? Where do they come from? Which pages do they view? And do they sign up, buy something or complete another important goal?
Those are simple questions, but answering them well can help you decide what to publish, which campaigns to continue and where your website needs work. This guide covers how web analytics works, the metrics worth knowing and how to put the data to use.
- What is web analytics?
- Why is web analytics important?
- How does web analytics work?
- Important web analytics metrics
- How to set up web analytics
- Common web analytics mistakes
- Choosing a web analytics tool
- Web analytics with Plausible
- Frequently asked questions
What is web analytics?
Web analytics is the collection, measurement and analysis of website data. Most of it falls into three areas:
- Acquisition: How visitors find you through search, referrals, social media, email and campaigns.
- Engagement: Which pages and actions visitors interact with.
- Conversion: Whether they complete an important outcome such as a purchase, signup or enquiry.
Put together, these reports show the journey from arrival to outcome. An ecommerce store, for example, can see which campaign brought visitors to a product page, how many started checkout and how many purchased. A publisher can find the articles that attract search traffic and lead to newsletter signups.
Why is web analytics important?
Without analytics, you are largely guessing whether your website is doing its job. With it, you can:
- understand which channels bring useful traffic;
- find popular and underperforming content;
- compare campaigns using conversions rather than clicks alone;
- identify drop-off in signup or checkout funnels;
- prioritize mobile, browser or location-specific improvements; and
- investigate unexpected traffic spikes and drops.
The purpose is not simply to collect numbers. It is to find what is working, what needs attention and what to do next.
That does not mean every decision has to begin in a dashboard. Analytics is most useful when it gives context to something you have already noticed or helps you check an assumption. If customers say that checkout is difficult, the funnel can show how widespread the problem is. If an article suddenly gets more attention, the sources report can show where those readers came from and whether they explored anything else.
How does web analytics work?
Most tools use a small JavaScript snippet added to each page. When someone loads a page, it sends a pageview event containing information such as the page URL, referrer, campaign parameters, device and browser.
The analytics service then turns those events into familiar reports for visitors, visits, pages, sources and conversions. Along the way, it may filter known bots and group individual sources into broader channels.
You can record custom events beyond pageviews, including form submissions, downloads, signups, cart activity and purchases.
Some tools use cookies or persistent identifiers to recognize browsers across visits. Others, including Plausible, provide cookieless web analytics without creating persistent visitor profiles.
JavaScript is the most common method, but it is not the only one. Server logs can see requests that browser scripts miss, although they also include bots and requests for files. Server-side events are useful for actions confirmed by your backend, such as a completed payment. Some websites combine these methods because each captures a different part of the activity.
Important web analytics metrics
An analytics dashboard can show dozens of metrics, but you can understand most websites with a relatively small set. Start with the size of the audience, learn where it came from, then look at what those visitors did. Add more measurements only when they help answer a real question.
| Metric | What it means |
|---|---|
| Visitors | Distinct visitors measured during a period |
| Visits or sessions | Separate periods of activity |
| Pageviews | Total tracked page loads |
| Views per visit | Average pages viewed during a visit |
| Visit duration | Time measured during a visit |
| Bounce rate | Visits with little or no further engagement |
| Conversions | Completed actions you define as important |
| Conversion rate | Percentage of visitors that complete a goal |
| Revenue | Purchase value connected to conversions |
You will find most of these metrics in any general web analytics product. Their exact definitions can differ, though, so check how each tool calculates them before comparing dashboards. Here are Plausible’s metric definitions.
Sources, pages and campaigns
Source reports show whether visitors came from search, referrals, social media, email, advertising or direct traffic. Entry pages show where visits began; top pages show what people viewed; exit pages show where visits ended.
These reports are most useful together. A list of top pages tells you what is popular, but not why people reached those pages or whether the visits were valuable. Filtering the dashboard by a page connects that content to its sources, audience and goals.
Direct is a fallback when referral information is unavailable, not only people typing your address. Use UTM parameters on campaign links to make attribution clearer.
Traffic is only the starting point. Filter a source or page and look at engagement, goals and revenue too. A smaller source with a strong conversion rate may be much more valuable than the one sending the most visitors.
Goals, funnels and journeys
A goal can be a thank-you page or an event such as Signup or Purchase. A funnel measures a known sequence, for example Product page → Cart → Checkout → Purchase.
This makes it easy to see where visitors stop. If you do not know the path in advance, website journey analytics can instead show what happened before or after a particular page or event.
Not every website needs a complicated funnel. A personal site may only need to measure contact-form submissions. A publication may care about newsletter signups. The point is to choose actions that reflect why the site exists rather than turning every click into a goal.
How to set up web analytics
It is tempting to design a complete tracking plan before installing anything. For most websites, a smaller start works better. Set up the basic traffic reports and one or two meaningful goals, use them for a while and let real questions guide what you add next.
- Define the website’s purpose. Choose one or two primary outcomes.
- Choose a suitable tool. Consider reports, privacy, ease of use, performance and cost.
- Install it on every relevant page. Include subdomains or checkout pages where needed.
- Verify the installation. Visit the site and confirm the pageview appears once in real time.
- Configure and test goals. Measure completed outcomes where possible.
- Tag campaigns consistently. Use agreed lowercase UTM values, but never add UTMs to internal links.
- Review useful comparisons. Compare periods and segment by source, page, campaign, device or country.
Our guide to checking your own website traffic walks through the complete process.
Once data starts arriving, give it enough time to become representative. Real-time reports are useful for confirming that tracking works, but a handful of visits cannot tell you whether a page or campaign is successful. Look at an appropriate date range and compare it with a similar period.
Common web analytics mistakes
Most analytics mistakes come from reading a number without asking what produced it or what the page was meant to do. The dashboard may be accurate while the conclusion drawn from it is not.
Treating more traffic as automatic success. A spike looks encouraging, but it may come from bots, an irrelevant referral or visitors who have no interest in what you offer. Traffic matters when it reaches the intended audience and produces useful outcomes.
Judging engagement without page context. A visitor can find an answer on one page and leave satisfied. An exit from a thank-you page is expected; an exit halfway through checkout is more interesting. A bounce or exit is not automatically bad.
Expecting different sources to match. Search engines count search clicks, ad platforms count ad clicks, servers count requests and web analytics products apply different visitor and session rules. Read why analytics numbers do not match.
Tracking everything. It is easy to assume that data may become useful later. In practice, hundreds of undocumented events make reports harder to trust and create unnecessary privacy risk. Collect events that answer real questions and make sure everyone understands what they mean.
Choosing a web analytics tool
Start with the decisions you need to make, since products with similar labels can solve quite different problems. General website analytics products such as Plausible and GA4 cover traffic, pages, campaigns and conversions. Behavior analytics products add heatmaps or session replay, while product analytics focuses on user histories, feature adoption and retention. Competitive analytics products estimate other websites’ traffic, but they cannot replace first-party analytics on a site you own.
You may need more than one category, but you probably do not need every category. A content site may be perfectly served by general web analytics and search-performance data. A software company may use web analytics for its marketing site and separate product analytics inside the application.
Compare tools using:
- reports and integrations;
- ease of use;
- data collection and privacy;
- documented metric definitions;
- script performance;
- data ownership and hosting; and
- subscription and operational costs.
If you need multi-month user or account retention, you may need product analytics too. Our web analytics vs product analytics guide explains the difference.
Whichever product you choose, test it with the people who will actually use it. A long feature list is not much help if answering a routine question requires specialist training or another custom report.
Web analytics with Plausible
We’re Plausible Analytics, and we have been building a simpler approach to web analytics since 2019. We bring visitors, visits, pageviews, sources, campaigns, pages, locations, devices, goals, revenue, funnels and journeys into one real-time dashboard. You can start with the overview, then click any entry to filter the rest of the dashboard and investigate further.
We do not use cookies, collect personal data or create persistent visitor profiles. Our script is lightweight, our cloud service is hosted in the EU and our code is open source.
We built it this way because most website owners do not need an individual history of every visitor. They need to understand what brings people to the site, which content works and whether visitors complete the actions that matter. Keeping those answers together also makes the dashboard useful to people who are not full-time analysts.
If that sounds like the kind of web analytics you need, you can explore our live public dashboard or start a free 30-day trial.
Frequently asked questions
What are the two main types of web analytics?
The two main types are on-site and off-site analytics. On-site analytics measures activity on a website you control, including visits, traffic sources, pages and conversions. Off-site analytics uses external data to estimate another website's traffic, search visibility or wider market performance. If you want accurate data for your own website, you should install an on-site analytics tool.
Is GA4 the same as web analytics?
No. Web analytics is the wider practice of collecting and analyzing website data, while GA4 is one product used to do it. Different web analytics products can collect data differently and offer different approaches to privacy, reporting and metric definitions. You do not need to use GA4 specifically to understand your website traffic and conversions.
Can web analytics work without cookies?
Yes. Cookies can help an analytics product recognize the same browser across multiple visits, but they are not required to measure aggregate traffic, sources, pages, campaigns and conversions. Plausible provides this information without cookies or persistent visitor identifiers, so you can understand how your website performs without creating long-term profiles of individual visitors.